Archive for the ‘ Irish E-Commerce ’ Category

Irish E-Commerce Survey Preliminary Report

The Irish E-Commerce Survey was undertaken by StudioForty9 as part of a standalone project to gather current and relevant statistics pertaining to the state of e-commerce in Ireland. There is presently a lack of information available on a market that is becoming increasingly important not only to the Irish market but to the global economy. The survey explored different business outcomes related to operating an e-commerce website including average conversion rate and basket value. It also delved somewhat into marketing costs and social media usage.

While 69 companies started the survey, only 33 companies provided e-commerce figures, and 29 fully completed the survey. Unfortunately, this small sample size limits the amount of statistical significance that can be placed on the data gained through the survey. Using a sample size calculator, with a 90% confidence interval allowing for a 10% margin of error, we would have needed 68 respondents. To decrease the margin of error to 5%, the ideal sample size jumps to 268 companies. These numbers were calculated using a population of 21,000 e-commerce companies determined by the following: 153,419 .ie domains registered at the end of 2010, 66% of which are business with 21% of those having e-commerce sites.

However, despite the small sample, the information gathered is interesting and among the first of its kind in the Irish market. It is the hope that companies will begin to see the importance of operating with this knowledge and take a more active role in future research.

The following are results gained from the Irish E-Commerce Survey:

The full report will be available on April 22nd; below is a sample of the information obtained.

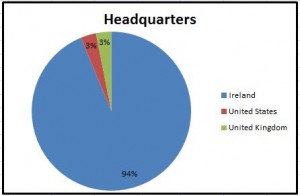
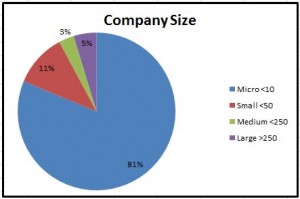
The majority (80% or 51 out of 64) of companies that responded are headquartered in Ireland and have less than 10 employees. That percentage increases to 94% (31 out of 33 respondents) in regards to those questions pertaining to specific e-commerce information

Graph of Company Headquarters InformationGraphy of Company Size Statistics

Average Conversion Rate and Basket Value

While the survey asked respondents to input the company’s average conversion rate, the information needed to manually calculate it was also collected. Based off 33 responses, when comparing the average conversion rate entered by the company (3.47%) to the one calculated by dividing total orders by total website visits (1.92%), it seems companies overestimate the actual percentage.

Similarly, the average basket value, calculated by dividing total website turnover by total orders, was also different, albeit reversed, between input values (€85.78) and calculated values (€107.80).

Channel Rankings of E-Commerce Sales Generation

To further understand companies’ perception of e-commerce sales generation, participants were asked to rank 9 different channels in order from the channel which generated the most sales (1) to the channel that generated the least (9). An average was then taken from the rankings of 22 respondents. While the top two were relatively close in ranking, email newsletter followed at a distant third with most others not far behind. Affiliate was noticeably last with 64% of respondents raking it in the 9th position. The following are the final ranking results with associated means: direct traffic (1.82), search engine traffic (1.95), email newsletter (4.68), referral traffic from other websites (5.00), Facebook (5.09), paid SEO traffic from Google AdWords (5.55), other social media (6.14), paid SEO traffic from other search engines (6.41), and affiliate (8.36).

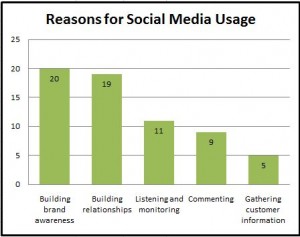
Reasons for Social Media Usage

AMAS recently conducted a survey which asked marketers why they used social media. We solicited the same information; with the same answer choices in order to understand if those dealing primarily with the e-commerce side of business, in small companies, would feel the same. While we had significantly fewer respondents to the question (30), interestingly, the ranking of reasons to use social media followed a similar pattern: building brand awareness (67%), building relationships (63%), listening and monitoring (37%), commenting (30%), and gathering customer information (17%).

Graphy of How Companies Use Social Media

Future Research

After the release of the full report on April 22nd, the survey will be re-launched and remain open to continue to collect information pertaining to the 2010 Financial Year. Because e-commerce is rapidly changing and has high growth and revenue potential, the Irish E-Commerce Survey will also be conducted annually to monitor and report on the sector.
Brief Preliminary Findings

The Irish E-Commerce Survey will be closing this Friday, April 1st. If you have not done so already, please take a moment to fill out the questionnaire: Go Direct to the E-Commerce Survey.

With only a week left of the Irish E-Commerce Survey, we have gathered some preliminary information. While an average of 55 companies responded to background information, there is only an average of 25 responses to those questions most significant to e-commerce. With more participation, the results will become more robust and relevant to those competing in the e-commerce market in Ireland.

While we believe all the survey questions have potential valuable insights, if you only have a short amount of time, we ask that you still take a moment to participate. Please answer the first few questions on company information and respond to the following questions: total online turnover, total website visits, and total orders placed through the website.


The following involve some of the early findings of the Irish E-Commerce Survey:

Because 93% of businesses who responded (55 out of 59) are headquartered in Ireland and 83% (48 out of 58) are micro with less than 10 employees, the following averages only take into account respondents fitting this criteria (across all industries).

Lifetime of E-commerce Site: 2.75 Years Range: 2 months – 8 years (48 Responses)

Average Total Turnover: €466,683 Range: €2,500 – €5.2M (27 Responses)

Average Online Turnover: € 114,704 Range: €520 – €380,000 (26 Responses)

*As seen from above, online sales are accounting for almost ¼ of total company turnover.

Average Conversion Rate: 1.87% Range: 0.00% – 4.52% (Calculated from 27 Responses)

Average Basket Value: € 102.73 Range: €3.33 – €404.76 (Calculated from 24 Responses)

85% (41 out of 48) of respondents to the question on what type of analytics software is used, have Google Analytics. However, only 60% (29 of 48) of respondents use the e-commerce tracking available in the analytics software.

In regards to what type of conversion rates are tracked through the e-commerce site, 90% (25 responses) look at sales while 21% (6 responses) also track registrations.

Information Needed for Survey

Since we know that everyone is busy with the day to day running of business, we wanted to provide as much information as possible to help prepare everyone for the survey. Some of the questions will be insight and opinion related. Below is a list of items that relate to questions requesting hard figures. Organizing this data in advance will speed up the survey taking process. All information requested in the survey will pertain to Financial Year 2010, and we ask that responses be in Euro where applicable. As a reminder, the survey is completely anonymous; however, any questions pertaining to sensitive company information will still be optional. We want you to feel comfortable and able to choose the information you would like to share. For further details on data privacy and protection, click here.

Company Corporate Information

Total Turnover

E-Commerce Website Information

Total Visits

Total Orders

Turnover

Average Conversion Rate

Average Basket Value

Average Bounce Rate

Pages Viewed per Visit

Time Spent on Website per Visit

Cost per Acquisition Information

Information regarding online and offline advertising spend related to the company’s e-commerce website(s) will also be requested (i.e. Google AdWord Spend, Facebook Advertising, TV, Radio, etc) .


Please feel free to contact us with any questions on how to access the information we are requesting or for definitions of specific survey terms.

Realex Payments on E-Commerce

For those who don’t know, Realex is a leading European payment services provider headquartered here in Ireland. With the start of 2011, the company has revealed some incredibly interesting e-commerce information. During 2010, Realex processed more than €9bn, an increase of around €3bn from the previous year. The growth came from both an increased number of companies signing up with Realex as well as an increased amount of volume from existing businesses. Additionally, consumers spent an average of €252 per transaction in November 2010; this was up from €182 in the same month of the previous year.

While the company is focused on international growth – over 50% of what they process is for international clients – the Irish market is still important and growing. Because of their interest in the Irish market, Realex “analysed the numbers for 2010, and of the total €9.6bn, approximately €1.4bn related to Irish based SMEs.” These numbers represented a 38% increase in what had been processed in 2009. 71% of this increase came from existing online retailers increasing their sales, while 29% represented new Irish online businesses.

Many thanks to Realex for providing such enlightening e-commerce information. For further details, please see:

Realex Payments announce profits of €780k as turnover increases to €7 million and

Irish businesses taking advantage of online commerce

Survey Questions Updated 3.3.2011

Another updated version of the survey with a few cost questions and a couple changes to social media questions. Let us know your feedback!

Irish E-commerce Survey Questions

New LinkedIn Group

We now have a LinkedIn group – The Irish E-Commerce Survey! Join the group and begin participating in the discussion on the upcoming survey and e-commerce in Ireland.

We have created the group to facilitate an ongoing discussion between those interested in Irish e-commerce. Updates on the Irish E-Commerce Survey will also be reported through the LinkedIn group.  Join now and get connected with others participating in Ireland’s e-commerce market and stay up-to-date on the latest information!

Amas Digital Marketing Survey

Amas, the Irish internet consultancy, released the latest State of the Net quarterly bulletin. There is a small article with information on Irish businesses online. Using data from the Central Statistics Office, it states that 87% of Irish businesses have broadband access. Of that percentage, only 23% of companies sell electronically while 49% purchase electronically.

The bulletin also contains some interesting findings on social media. The company recently conducted a survey on digital marketing with 400+ Irish marketers participating. The following highlight some of the findings:

  • Social media is used primarily to build relationships (84%) and brand awareness (76%) as well as monitor what consumers are saying about companies (66%)
  • The top online marketing format is still email campaigns (67%) followed by blogs / social networking (55%), search engine optimisation (52%), and banner advertising (49%)
  • Marketing budgets are shifting towards online spending – over 1/3 of participants are spending over 21% of budgets on digital marketing
  • Top 3 social media sites companies are using for communication: Facebook, LinkedIn, and Twitter

Amas has posted the full results of the survey on their SlideShare channel, to view click here.

Source: 2011 Irish Online Marketing Sentiment Survey. Marketing Institute of Ireland / Amas

Version 3 of Survey Questions

We have once again updated the questions that will potentially be in the upcoming Irish E-Commerce Survey. Thanks to Cormac’s suggestions, we have added a couple of questions on social media and other online marketing efforts. Please share with us your opinion on which questions you perceive as most valuable to you and your company. We want all parties involved to benefit from the information gathered through the survey.

Irish E-commerce Survey Questions

Updated Survey Questions

We have made some changes to the questions regarding industries and specialisations in which companies compete. We have also added one or two questions on perceptions of market size. The updated version has been attached, please take a moment to review the changes.

Let us know what you think of the survey content! We welcome feedback on how you feel about the type of information we will be requesting – What do you think will be useful? Is there anything you are not interested in knowing? What other statistics would you like to have?

Comment through the blog, email us at info@irishecommercesurvey.com, or tweet us @irishecommerce.

Irish E-commerce Survey Questions Draft 2

Irish E-Commerce Survey Questions

Goals and Objectives: To develop an independent survey on the state of Irish e-commerce that will provide anonymity to survey respondents but will allow participants’ a greater understanding of this sector.

Below is a link to a draft of the survey questions to aid in further understanding of the types of information that will be addressed. The survey includes questions about the participant, company background information, online activity data (how many websites the company operates, geographic markets, perceived market size), e-commerce statistics (traffic, conversion rate, turnover, orders), and other website information (bounce rate, Google AdWords expenditures, Facebook CTR).

We welcome any comments or suggestions you would like to offer about the content of the survey. Please feel free to comment through the blog or email us directly at info@irishecommercesurvey.com.

Irish E-commerce Survey Questions